
You can interpret that as Babcock shitting on Corsi if you want, and then you can laugh at all of the nerds, but I think the real truth there is that the whole thing is a lot more complex.I asked Mike Babcock what constitutes a good game for the Hunwick/Polak pairing. Here's what he said: pic.twitter.com/QWQJdEzwqg— Chris Johnston (@reporterchris) December 15, 2016
Obviously, based on Babcock's quote, the Hockey Twitter charts and graphs and stuff that strictly rely on Corsi are going to differ from what NHL coaches evaluate to ice their lineups. The Maple Leafs' Hunlak pairing is largely trash, at least according to the analytics community. They are probably trash according to a lot of communities, and that's why they combine to make less than $3.5 million per season even though they're both well beyond entry-level and RFA contracts.
(Side note: please note, Hockey Internet Community, that a third pairing defenseman who makes a million bucks a year doesn't have to be an elite play-driver or shutdown blueliner. You need role players too, especially in a league with a salary cap. Everyone can't be PK Subban.)
So I went on Corsica and narrowed the Skaters section down to defensemen who have played 300+ minutes this season. I then did a little bit of sabermetrics to add up Babcock's preferred stats, "did the puck go in or did they get scoring chances against?"
I combined Scoring Chances and Expected Goals. I used the Per 60 metrics because our list of "regular" defensemen ranges from Duncan Keith's 577 minutes to Paul Postma's 302 minutes. Per 60 seems to be the most fair and simple way to account for that.
And I chose Expected Goals instead of Actual Goals for two reasons. First, I wanted to factor out goaltender play, because goalies are weird and I don't think we should punish defensemen who play in front of a goalie who is worse than someone else's goalie (via HockeyViz):

In total, we have 154 defensemen on our list. Six of those 154 happen to play for the Philadelphia Flyers. But before we put the Philly spin on it, let's look at who is Good and Bad around the league.
Most Scoring Chances And Expected Goals For Per 60
| Player | Pos | Team | SC+xGF/60 | |
| 1 | JAKE.GARDINER | D | TOR | 18.01 |
| 2 | ROMAN.POLAK | D | TOR | 16.32 |
| 3 | CONNOR.CARRICK | D | TOR | 15.62 |
| 4 | JUSTIN.SCHULTZ | D | PIT | 15.4 |
| 5 | IAN.COLE | D | PIT | 15.02 |
| 6 | KRIS.LETANG | D | PIT | 14.99 |
| 7 | JEFF.PETRY | D | MTL | 14.69 |
| 8 | MATTHEW.BENNING | D | EDM | 14.64 |
| 9 | PAUL.MARTIN | D | S.J | 14.49 |
| 10 | BRENT.BURNS | D | S.J | 14.36 |
| 11 | MORGAN.RIELLY | D | TOR | 14.21 |
| 12 | ANTON.STRALMAN | D | T.B | 14.1 |
| 13 | KEVIN.KLEIN | D | NYR | 14.09 |
| 14 | DAVID.SAVARD | D | CBJ | 13.97 |
| 15 | TREVOR.DALEY | D | PIT | 13.95 |
| 16 | JACK.JOHNSON | D | CBJ | 13.91 |
| 17 | NICK.HOLDEN | D | NYR | 13.84 |
| 18 | ANDREI.MARKOV | D | MTL | 13.79 |
| 19 | RYAN.MCDONAGH | D | NYR | 13.72 |
| 20 | THOMAS.HICKEY | D | NYI | 13.7 |
I'm going to be honest, I had no idea Polak was going to appear on any of the lists that were good. This is offensive defensemen, though, so naturally the list also includes names like Letang and Burns.
Fewest Scoring Chances And Expected Goals Against Per 60
| Player | Pos | Team | SC+xGA/60 | |
| 1 | MATT.DUMBA | D | MIN | 7.26 |
| 2 | MARC.VLASIC | D | S.J | 7.54 |
| 3 | KEVIN.SHATTENKIRK | D | STL | 7.63 |
| 4 | TOREY.KRUG | D | BOS | 7.67 |
| 5 | ESA.LINDELL | D | DAL | 7.91 |
| 6 | STEPHEN.JOHNS | D | DAL | 7.97 |
| 7 | ADAM.MCQUAID | D | BOS | 8.24 |
| 8 | ALEXEY.MARCHENKO | D | DET | 8.27 |
| 9 | JOHNNY.ODUYA | D | DAL | 8.31 |
| 10 | JONAS.BRODIN | D | MIN | 8.32 |
| 11 | MICHAL.KEMPNY | D | CHI | 8.47 |
| 12 | RASMUS.RISTOLAINEN | D | BUF | 8.54 |
| 13 | YOHANN.AUVITU | D | N.J | 8.56 |
| 14 | JOSH.GORGES | D | BUF | 8.66 |
| 15 | JUSTIN.BRAUN | D | S.J | 8.67 |
| 16 | NATE.SCHMIDT | D | WSH | 8.74 |
| 17 | IAN.COLE | D | PIT | 8.76 |
| 18 | ALEXEI.EMELIN | D | MTL | 8.77 |
| 19 | ROMAN.JOSI | D | NSH | 8.86 |
| 20 | MICHAEL.MATHESON | D | FLA | 8.9 |
| 21 | P.K..SUBBAN | D | NSH | 8.93 |
| 22 | FEDOR.TYUTIN | D | COL | 8.95 |
I extended this list out to 22 to include Subban and Tyutin to basically prove that none of this means anything. But in terms of shutdown blueliners, this list nails it in some areas and whiffs in others. Vlasic, Shattenkirk, Josi, yeah, sure. But it was my understanding that Josh Gorges and Rasmus Ristolainen were two of the worst defensemen in the whole league? Maybe I was mistaken?
Best Scoring Chance And Expected Goals For Percentage ("Babcock Percentage")
| Player | Pos | Team | SC+xGF% | |
| 1 | IAN.COLE | D | PIT | 63.2% |
| 2 | JUSTIN.SCHULTZ | D | PIT | 61.4% |
| 3 | JAKE.GARDINER | D | TOR | 60.8% |
| 4 | CONNOR.CARRICK | D | TOR | 60.7% |
| 5 | MATTHEW.BENNING | D | EDM | 59.2% |
| 6 | ANTON.STRALMAN | D | T.B | 58.7% |
| 7 | JEFF.PETRY | D | MTL | 57.9% |
| 8 | TOREY.KRUG | D | BOS | 57.9% |
| 9 | ROMAN.JOSI | D | NSH | 57.7% |
| 10 | RASMUS.RISTOLAINEN | D | BUF | 57.6% |
| 11 | NATE.SCHMIDT | D | WSH | 57.5% |
| 12 | ALEXEI.EMELIN | D | MTL | 57.5% |
| 13 | CAM.FOWLER | D | ANA | 57.2% |
| 14 | P.K..SUBBAN | D | NSH | 57.1% |
| 15 | RYAN.MCDONAGH | D | NYR | 57.1% |
| 16 | STEPHEN.JOHNS | D | DAL | 56.7% |
| 17 | ANDREI.MARKOV | D | MTL | 56.4% |
| 18 | KEVIN.SHATTENKIRK | D | STL | 56.4% |
| 19 | ROMAN.POLAK | D | TOR | 56.2% |
| 20 | JOSH.MANSON | D | ANA | 56.0% |
| 21 | SHEA.WEBER | D | MTL | 56.0% |
| 22 | MARC.VLASIC | D | S.J | 56.0% |
| 23 | BRETT.PESCE | D | CAR | 55.8% |
| 24 | ALEC.MARTINEZ | D | L.A | 55.8% |
| 25 | ALEXEY.MARCHENKO | D | DET | 55.5% |
| 26 | TREVOR.DALEY | D | PIT | 55.4% |
| 27 | KRIS.LETANG | D | PIT | 55.1% |
| 28 | JARED.SPURGEON | D | MIN | 55.0% |
| 29 | JAKE.MUZZIN | D | L.A | 55.0% |
| 30 | TOBIAS.ENSTROM | D | WPG | 55.0% |
| 31 | RON.HAINSEY | D | CAR | 55.0% |
I blew this list all the way out to 31 to include everyone at 55% or better. And, again, the Pittsburgh and Toronto guys seem to be getting a huge bump. Matthew Benning, in all likelihood, is not the fifth best defenseman in the NHL.
But there are a lot of names in this mix that are almost always among the list of best defensemen - Stralman, Josi, Subban, McDonagh, Shattenkirk, Weber, Vlasic, Martinez (kind of?), Letang. I guess it's not necessarily a horrible statistic to look at, but obviously something weird is going on that allows Roman Fucking Polak to be included right in the middle of those perennial All-Stars and guys that are supremely underrated.
Best Difference Between Actual On Ice Goals For Percentage And "Babcock Percentage"
| Player | Pos | Team | SC+xGF% | GF% | GF%Rel | |
| 1 | BRENT.SEABROOK | D | CHI | 45.1% | 69.3% | 24.2% |
| 2 | NATHAN.BEAULIEU | D | MTL | 44.8% | 68.7% | 23.9% |
| 3 | DENNIS.SEIDENBERG | D | NYI | 50.4% | 70.0% | 19.6% |
| 4 | KARL.ALZNER | D | WSH | 43.5% | 61.5% | 18.0% |
| 5 | SHEA.WEBER | D | MTL | 56.0% | 73.8% | 17.8% |
| 6 | YOHANN.AUVITU | D | N.J | 43.5% | 60.1% | 16.6% |
| 7 | GUSTAV.FORSLING | D | CHI | 41.4% | 57.8% | 16.5% |
| 8 | BRIAN.CAMPBELL | D | CHI | 46.8% | 62.9% | 16.1% |
| 9 | CALVIN.DE HAAN | D | NYI | 51.0% | 66.6% | 15.6% |
| 10 | DUNCAN.KEITH | D | CHI | 45.8% | 60.8% | 15.0% |
| 11 | MATT.NISKANEN | D | WSH | 45.8% | 59.9% | 14.1% |
| 12 | RYAN.SUTER | D | MIN | 51.9% | 65.8% | 13.9% |
| 13 | MARKUS.NUTIVAARA | D | CBJ | 50.0% | 63.1% | 13.1% |
| 14 | MARK.GIORDANO | D | CGY | 49.4% | 62.5% | 13.1% |
| 15 | NIKITA.NESTEROV | D | T.B | 44.8% | 57.9% | 13.1% |
| 16 | ALEX.GOLIGOSKI | D | ARI | 32.2% | 44.7% | 12.4% |
| 17 | KRIS.RUSSELL | D | EDM | 47.1% | 59.3% | 12.2% |
| 18 | DAVID.SAVARD | D | CBJ | 53.6% | 65.6% | 12.1% |
| 19 | JARED.SPURGEON | D | MIN | 55.0% | 66.8% | 11.7% |
| 20 | DERYK.ENGELLAND | D | CGY | 46.9% | 58.6% | 11.7% |
| 21 | DMITRY.ORLOV | D | WSH | 49.3% | 59.4% | 10.1% |
| 22 | BROOKS.ORPIK | D | WSH | 52.5% | 62.5% | 10.1% |
These are the guys that, for whatever reason, are on the ice more than their scoring chance and expected goal metrics would lead you to think they would be. There almost has to be a Team Shooting Percentage element to this, especially because Chicago, Montreal, Washington, and the Islanders appear so frequently (those four teams have 12 of the 22 names on the list).
The league median for shooting percentage is 8.9%. Chicago is sitting at 9.18%, Montreal 10.38%, and the Islanders and Capitals are both right around that league average. So maybe I'm just a fucking idiot.
How, then, have Seidenberg, Alzner, De Haan, Niskanen, Orlov, and Orpik all managed to outperform their scoring chance and expected goals numbers? I'm going to get super sidetracked here and try to see if teammate quality is our answer.
New York Islanders
- Calvin De Haan and Dennis Seidenberg play together, and they get the ice time (and competition) that you'd expect of a second- or third-pairing of blueliners. I'm drawing a blank on this one. Moving on!
Washington Capitals
- Karl Alzner and Matt Niskanen are the Caps' top pair. They routinely get matched against their opponents' top pair and (even moreso) top line, but their quality of teammates is a bit more heavy toward the top of the Caps' depth chart. Again, I don't quite get it.
- Dmitry Orlov primarily plays with John Carlson, and I guess they'd be the second pairing. Their deployment is exactly what you'd expect for a second pairing.
- Brooks Orpik primarily plays with Nate Schmidt, and the third pairing is used as a third pairing.
- So, if you're keeping score at home, all four of the Caps that made our list aren't particularly sheltered and the team doesn't shoot a particularly high percentage, but they are all on the ice for about 10% more goals than we would project based on scoring chances and expected goals.
We're going to cut that part and just move on to The Flyer's.
The Philadelphia Flyers Defensemen
These ranks are all out of the 154 defensemen who have played 300+ minutes at 5v5.
Scoring Chances Plus Expected Goals For Per 60 (Babcocks For Per 60)
- 1. Jake Gardiner (TOR), 18.01
- 67. Shayne Gostisbehere, 11.19
- 111. Radko Gudas, 9.54
- 112. Andrew MacDonald, 9.47
- 131. Mark Streit, 8.73
- 139. Ivan Provorov, 8.18
- 142. Brandon Manning, 7.95
- 154. Yohann Auvitu (NJ), 6.59
For a team that I thought was a pretty high-octane offense, those numbers are not great. They might even be bad. Ghost is the only player in the top half of the league (and the top two-thirds).
Scoring Chances Plus Expected Goals Against Per 60 (Babcocks Against Per 60)
- 1. Matt Dumba (MIN), 7.26
- 36. Radko Gudas, 9.53
- 41. Andrew MacDonald, 9.61
- 65. Brandon Manning, 10.19
- 82. Ivan Provorov, 10.94
- 93. Shayne Gostisbehere, 11.38
- 143. Mark Streit, 13.17
- 154. Alex Goligoski (ARI), 17.65
Here's where the Flyers defensemen are going to (kind of) shine. Gudas and MacDonald are both in the top third, and Manning/Provorov/Gostisbehere are in the middle third. Mark Streit is bad at defending, but maybe pairing him with Gudas once he returns from injury will help that.
Babcock For Percentage
- 1. Ian Cole (PIT), 63.2%
- 79. Radko Gudas, 50.03%
- 85. Andrew MacDonald, 49.63%
- 87. Shayne Gostisbehere, 49.58%
- 135. Brandon Manning, 43.83%
- 140. Ivan Provorov, 42.78%
- 148. Mark Streit, 39.86%
- 154. Alex Goligoski (ARI), 32.2%
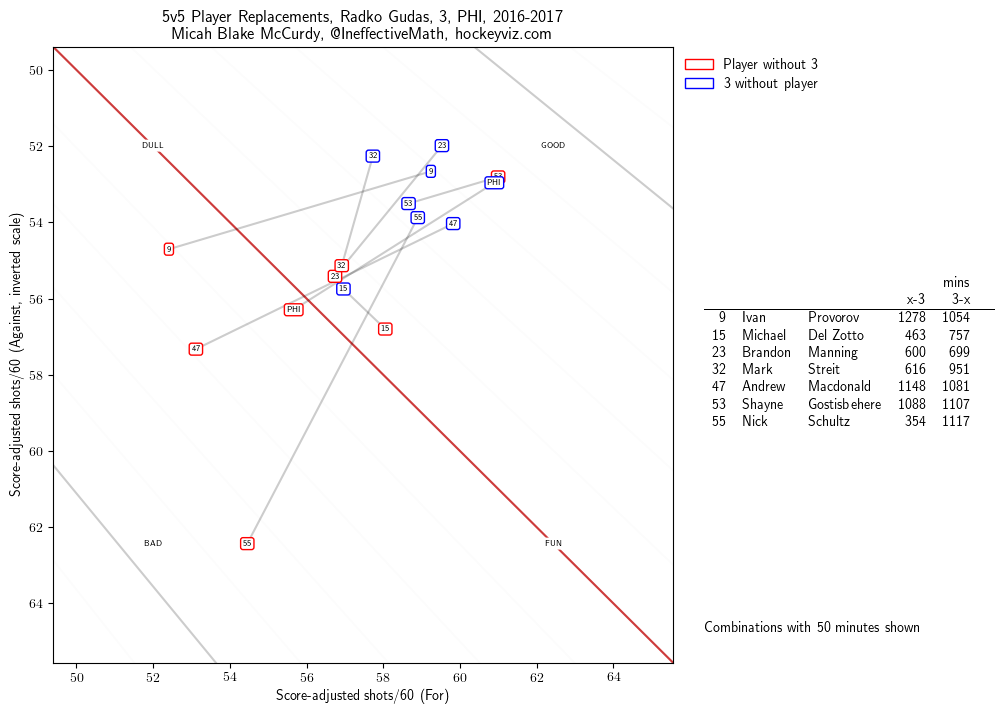
So, basically, there are three Flyers that are about breakeven in Babcock-ing. MacDonald and Gostisbehere have primarily played together this season, so it would make sense that their metrics are almost identical. But Gudas has played nearly all of his 5v5 minutes with either Streit, Manning, Or Provorov. How can he be above breakeven when his three usual partners are six or seven (or ten) percentage points back?
The answer is simple: Radko Gudas is a really fucking solid NHL defenseman. Nearly every player in the Flyers lineup is worse without Gudas. Gostisbehere is the only exception so far this year, and my guess would be that's related to Ghost being more sheltered than Gudas.
And as for our prized young Future Norris Candidate, let me make the following excuse for Provorov. As you can see below, he's playing the minutes of a first-pairing defenseman, primarily with second-and third-line forwards as teammates, and he's consistently facing the opposition's top line and top defenseman (because, you know, he's the Flyers number one all-around defenseman). He's fine.

No comments:
Post a Comment